The Glimt platform
We’ve learned so much by studying cells. But what if we’ve only seen half the picture? With the Glimt platform, Moleculent introduces a new era of functional profiling, revealing how cells talk to shape the biology of health and disease.
The Glimt advantage
Directly measure receptor–ligand engagement in tissue, rather than relying on indirect inference.
Optimized for FFPE tissue, making functional profiling applicable to a wide range of clinical samples.
An integrated platform from tissue section to analyzed interaction data, designed for reproducible results.
Decode individual receptor–ligand interaction events at single-molecule resolution.
Dual-antibody recognition provides highly specific detection of molecular interactions.
Automated processing enables consistent, reproducible measurements with minimal hands-on time.
Instrument
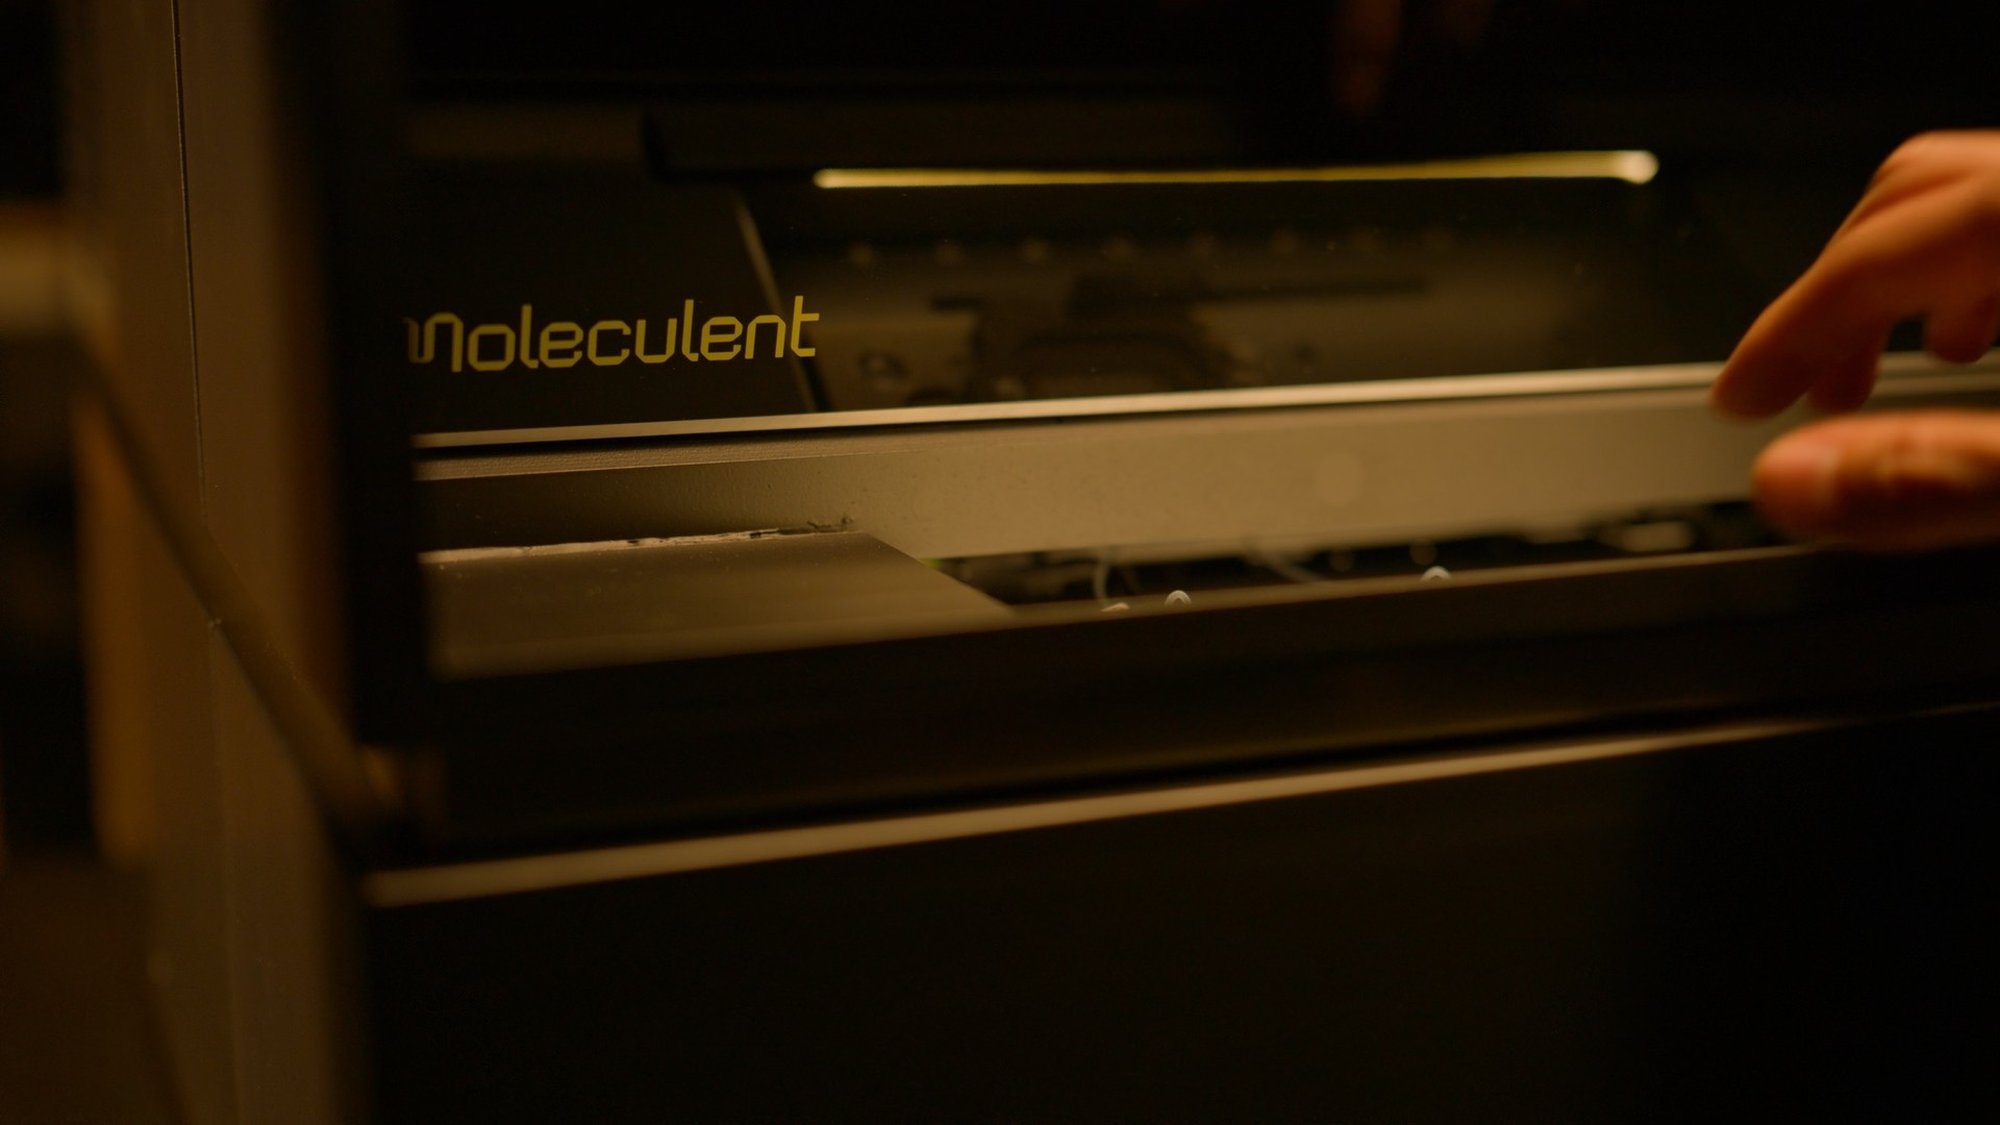
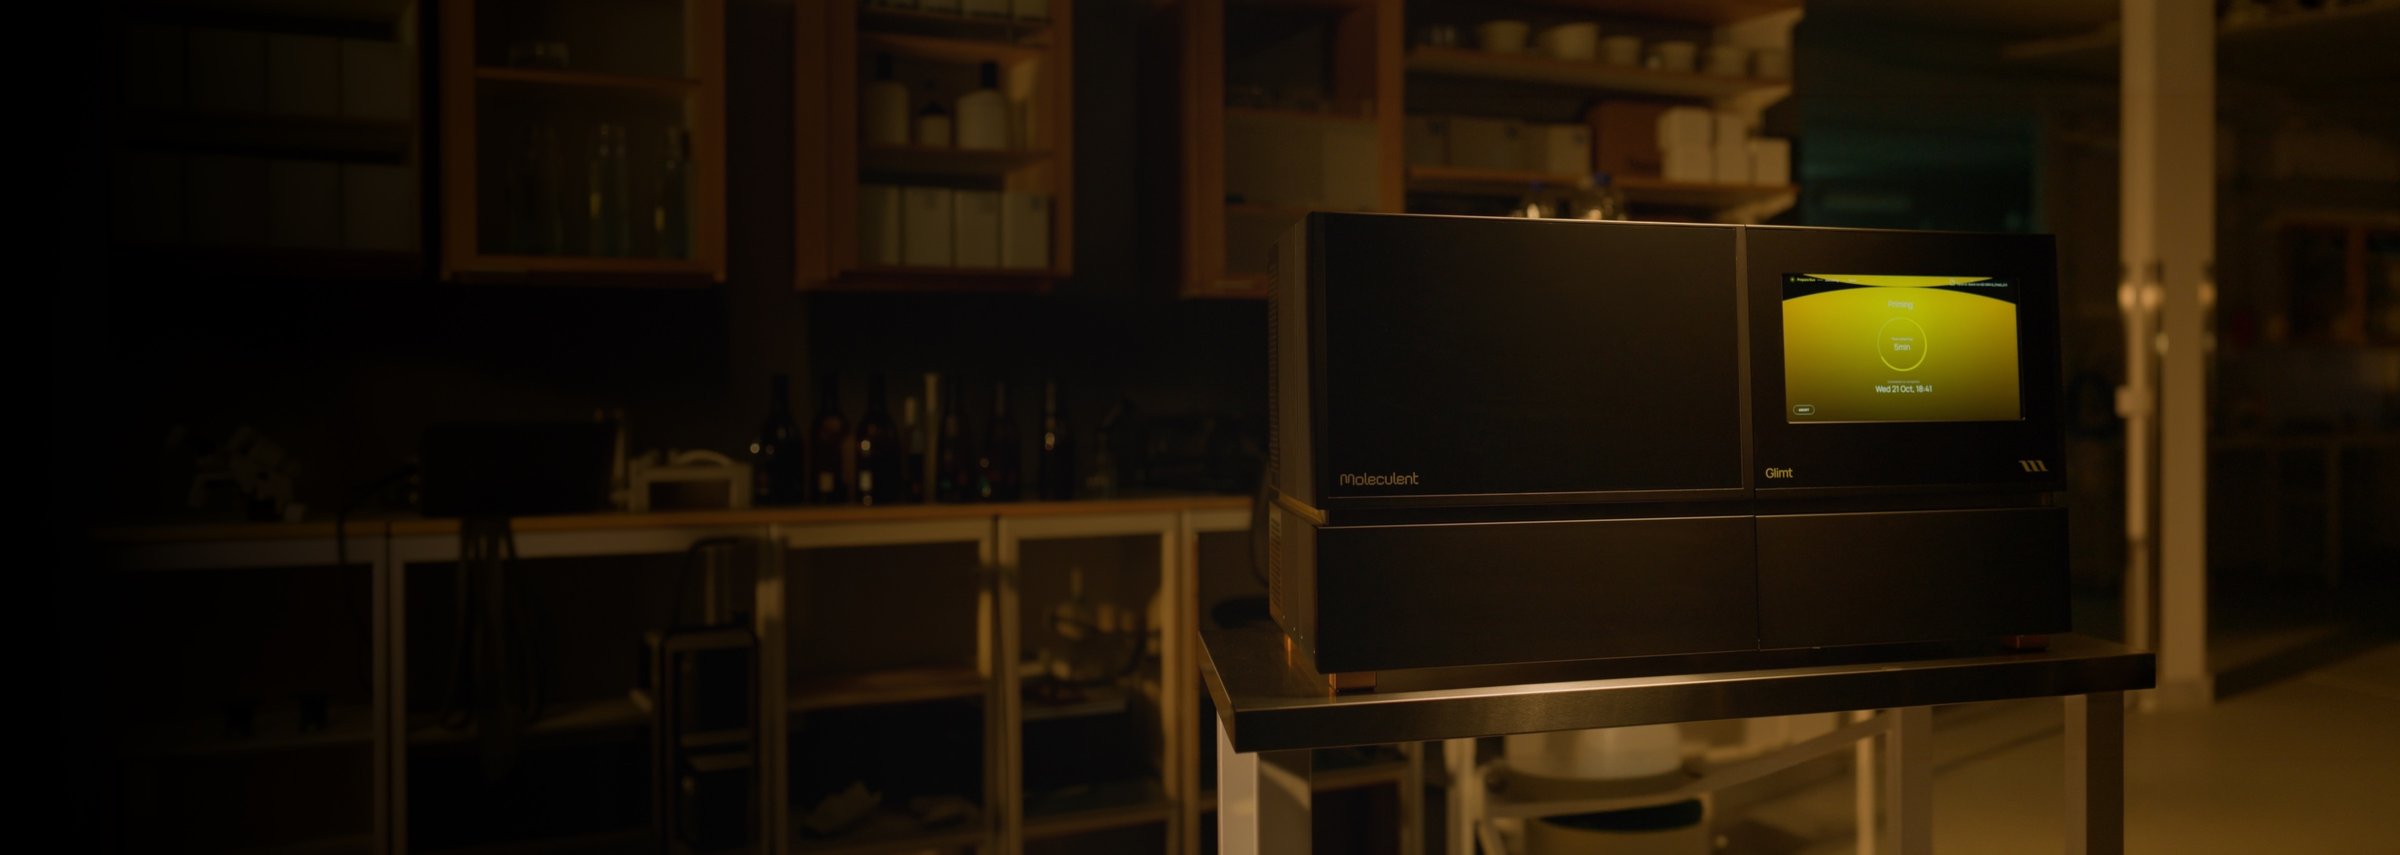
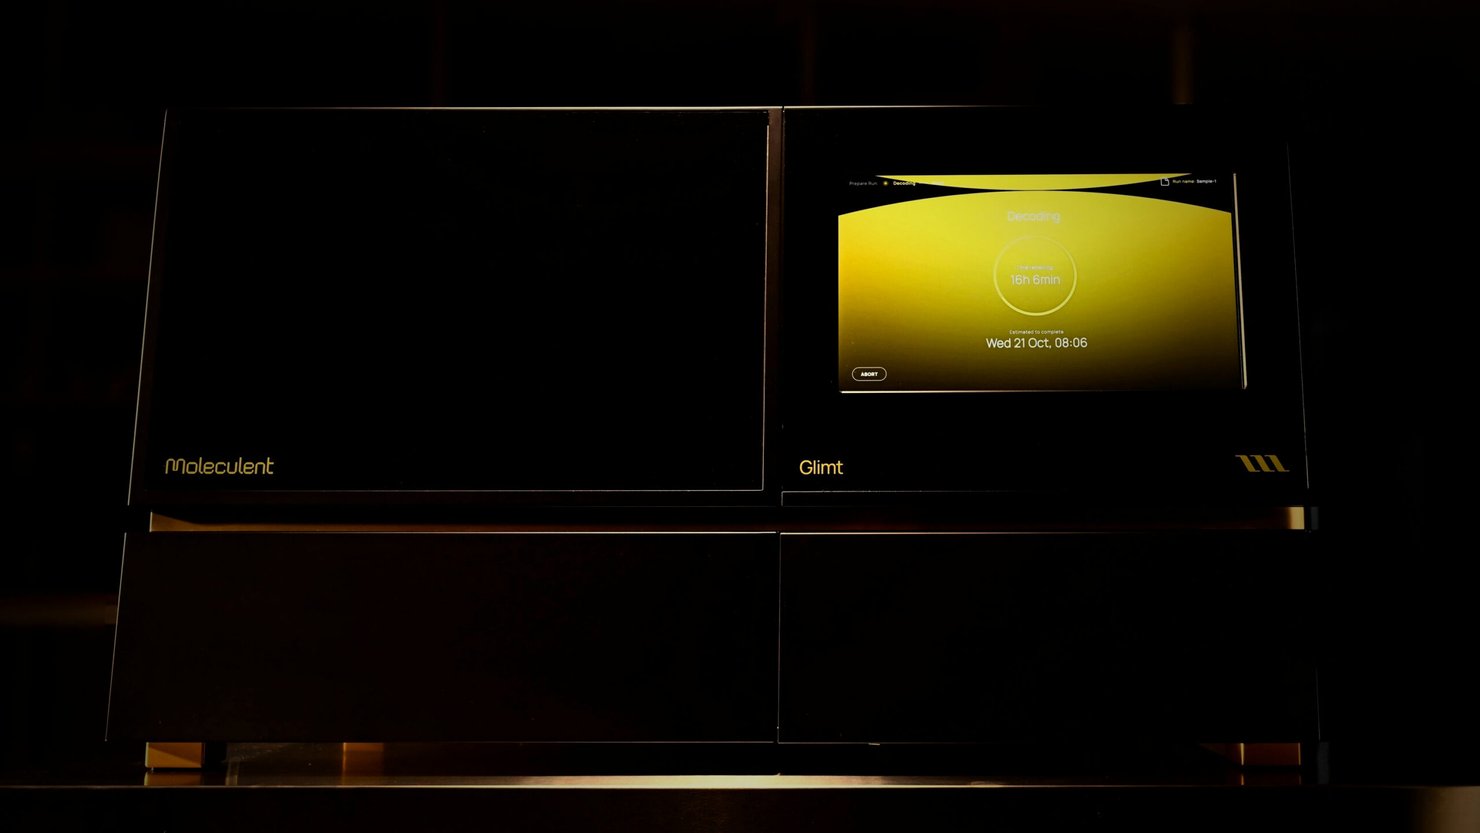
The Glimt instrument brings functional profiling into your lab through a streamlined, automated workflow. With intuitive software and minimal hands-on time, it makes sophisticated molecular measurements easier to perform consistently and reproducibly.
Step 01
Moleculent’s proprietary proximity ligation assay (PLA) technology detects receptor–ligand engagement using pairs of oligo-conjugated antibodies. When the target molecules are in proximity, a detection molecule is formed and amplified using Moleculent’s chemistry. Protein-specific antibodies identify cell types, providing spatial context for understanding which cell populations are involved in each interaction.
Step 02
The Glimt instrument decodes molecular signals through repeated cycles of fluorescent labeling, imaging and signal removal. Optimized for FFPE tissue, its automated workflow is designed to process two slides in parallel within 48 hours, measure tens to hundreds of interaction targets per sample, and deliver high reproducibility with minimal hands-on time.
Step 03
The resulting data brings together three complementary layers of information: nuclei, cell types and receptor–ligand interactions. By combining these measurements in their original tissue context, functional profiling reveals where molecular engagement occurs, which cell populations are involved and how interactions are distributed across the tissue.
Panel
Interactions
Cell types
The Glimt panel brings together key receptor–ligand interactions and cell-type markers, enabling direct measurement with unprecedented accuracy. See multiple interactions simultaneously, with exceptionally clear molecular signals and the cellular context needed to understand them. For the first time, a comprehensive functional picture of tissue biology comes into view.
This is only the beginning. We’re building towards a future where functional profiling spans every major human organ and biological pathway, opening new possibilities for understanding health and disease.
Data
Explore complex functional profiling data through a beautifully simple, interactive interface. Easily navigate samples, select the markers and interactions that matter to your research, and explore your results at your own pace. Everything is designed to put you in control, making it easier to focus on the questions that drive your discoveries.